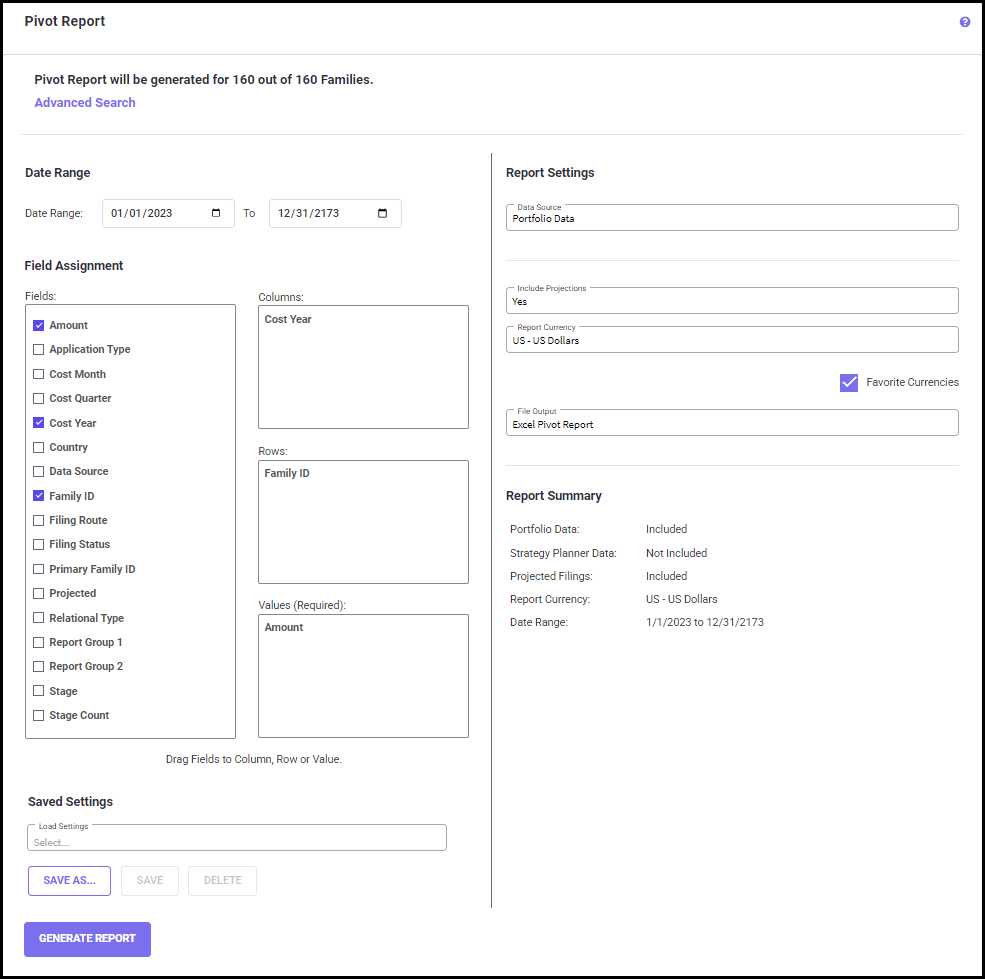
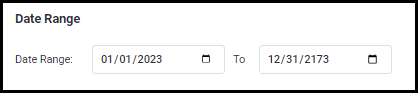
Date Range
The Date Range option helps you to choose the start and end date for the report.
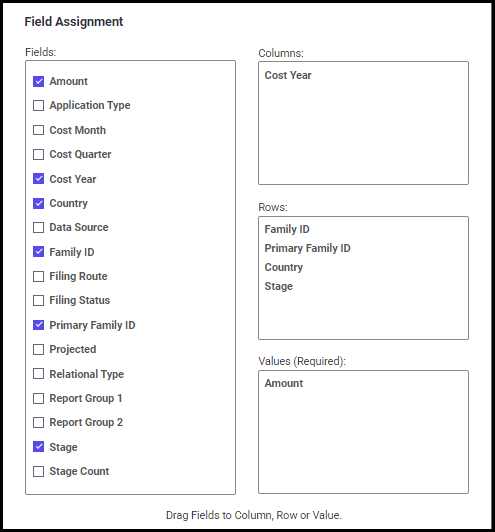
Field Assignment
The Field Assignment settings allow you to choose the field names and set your preferences to show the selected field names in a row, column, or as a value. You can also set the field order for each field name by placing them in the desired order. The field name at the top will be displayed first in the report.
Report Settings
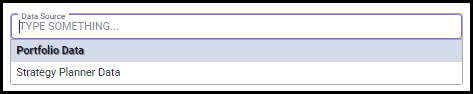
Data Source: The program retrieves information from both Portfolio Data and Strategy Planner Data. Here you can select any one of the two data sources or both using the right arrow next to the drop-down arrow.
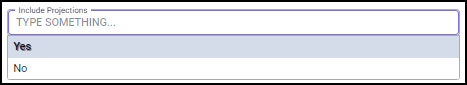
Include Projections: If you want to include projections (for details see Projected Filings section) in the Pivot Table report, select ‘Yes’ from the drop-down list. If not, select ‘No’.
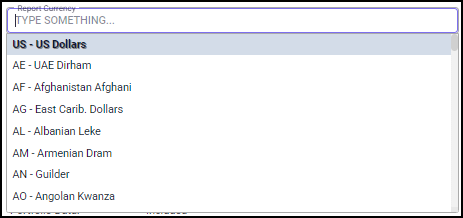
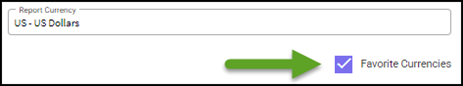
Report Currency: Use the drop-down box to select a currency for the amounts in the report. If the “Favorite Currencies” checkbox is checked, only the favorite currencies selected on the Currency & Exchange Rates > Edit Favorite Currencies screen will show up in the selection.
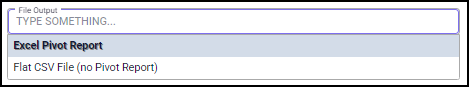
File Output: This option allows you to select the output file format by selecting either “Excel Pivot Report” or “Flat CSV File” from the drop-down list.
Report Summary
The Report Summary field shows a quick summary of the report settings along with the selected date range.
Saved Settings
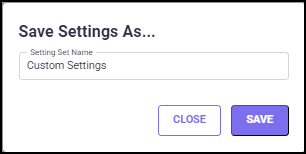
On the bottom part of the screen, you have the option to save the settings that you customized on this page. Click the SAVE AS button and enter a Set Name in the text box (shown below). Then click SAVE. Choosing CLOSE will lose the Save Setting As pop-up screen without saving your changes.
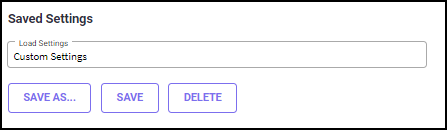
When you make changes to the saved set, click SAVE to save the changes. To delete a created set, select the set to be deleted from the Saved Settings drop-down list, and click the DELETE button.
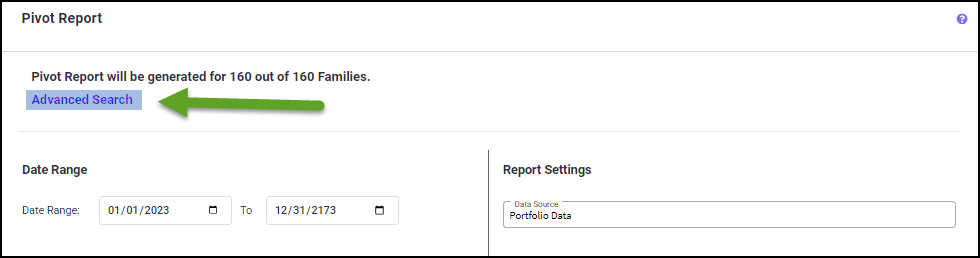
The
Advanced Search option helps you to easily drill down into your portfolio to find what you are looking for. There are various filters provided in the Advanced Search settings. You can filter the families by Family ID/Title, Groups, date range, Application Type, and other criteria to run specific pivot table reports. You can also save the defined settings for future use here. For more information regarding how to use the advanced filters and save settings, see
Advanced Search.
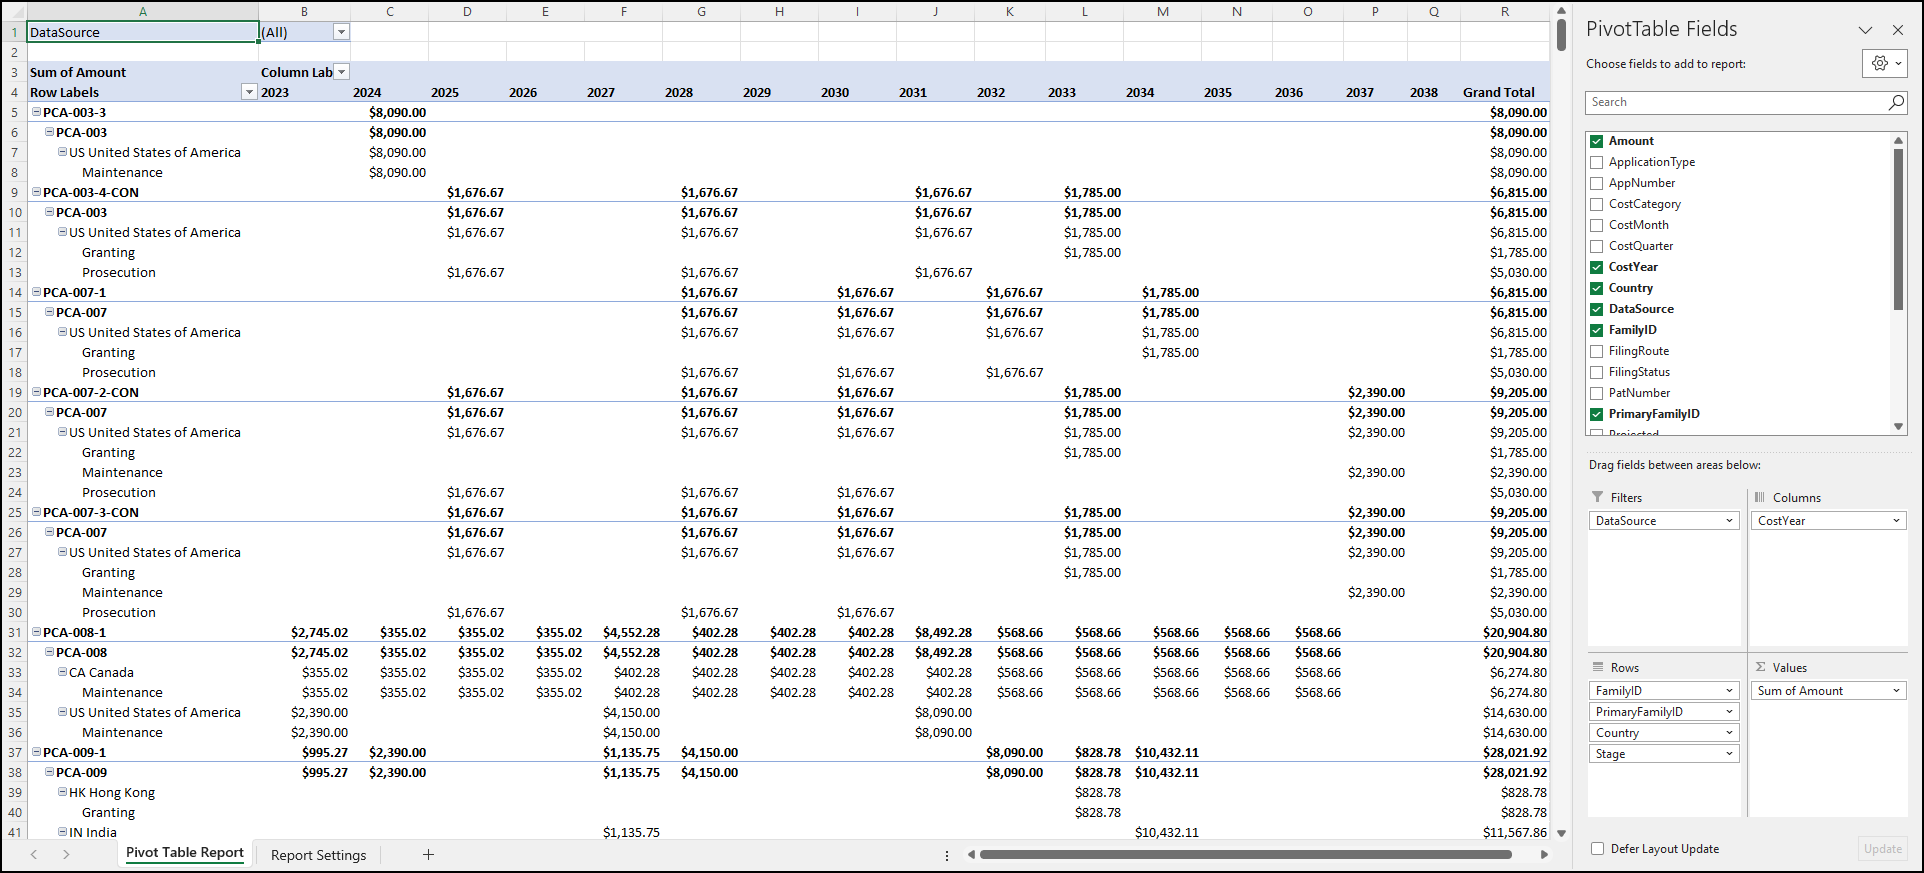
Once you have customized all the filters on this screen, click on the GENERATE REPORTS button to initiate calculations. You will be directed to the Download Reports screen, where the generated Pivot Table report is ready for download.