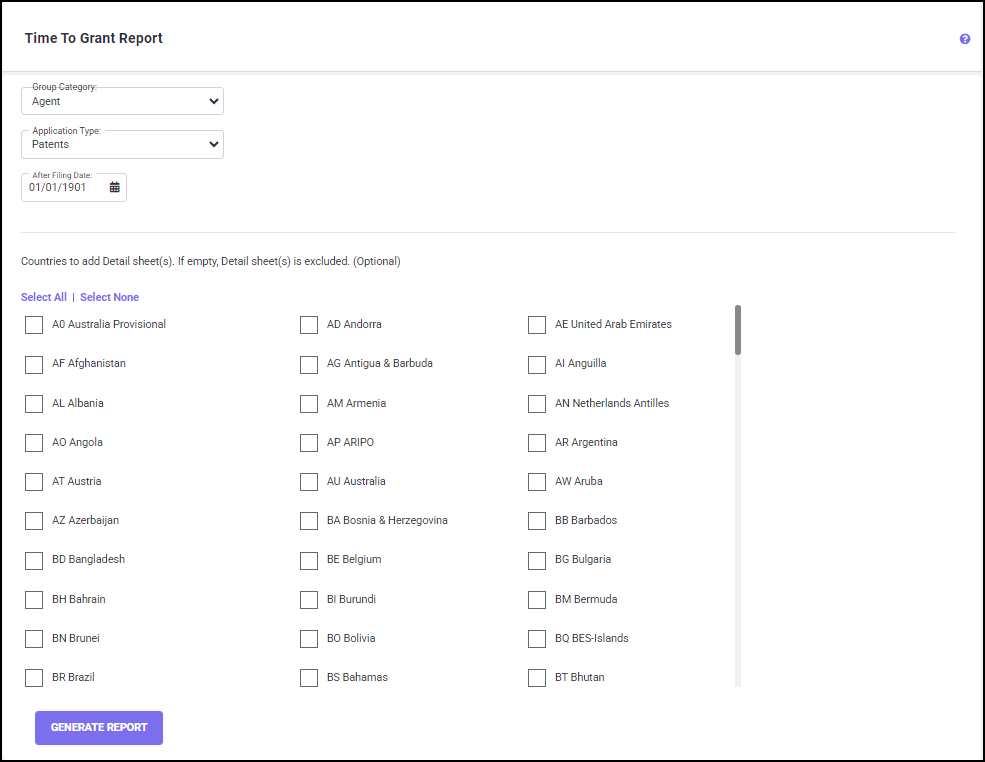
On this screen, you have filters which provide you with the option to:
· Select the Group Category, the Application type and the earliest filing date for filtering only the filings in selected families for which you wish to generate the Time to Grant Analysis report; and
· Select country (one or more countries) for which a separate detailed report is desired in the Time to Grant Analysis report.
Choose which countries to be included for a separate detailed report. There are ‘Select All/Select None’ options used to either select or deselect all countries. Countries may also be selected or unselected individually by clicking on the respective checkbox for the country in the list. This creates a separate tab in the Excel output file for each country selected.
Select a Group Category from the drop-down list, which will be used as a primary group in the report. Any non-multi group category (not allowing multiple group assignment per family) will be available for selection here.
There are also a few other ways to limit the analysis. Select one application type (Patent, Design or Utility Model) to report on by using the drop-down arrow in the box for the ‘Application Type’. You may change the date in the calendar field. This provides you with the flexibility of analyzing all the filings in your portfolio or limiting the analysis to only more recent filings.
Once you have set all the filters, click on the GENERATE REPORT button to initiate calculations.
You will be directed to the Download Reports screen, where the generated Time to Grant report is ready for download.
The generated Excel report contains three summary worksheets, which show the time to grant information for the selected filings:
· Country Summary (one line per country)
· Country – Group Summary (one line per group within each country)
· Group – Country Summary (one line per country within each group)
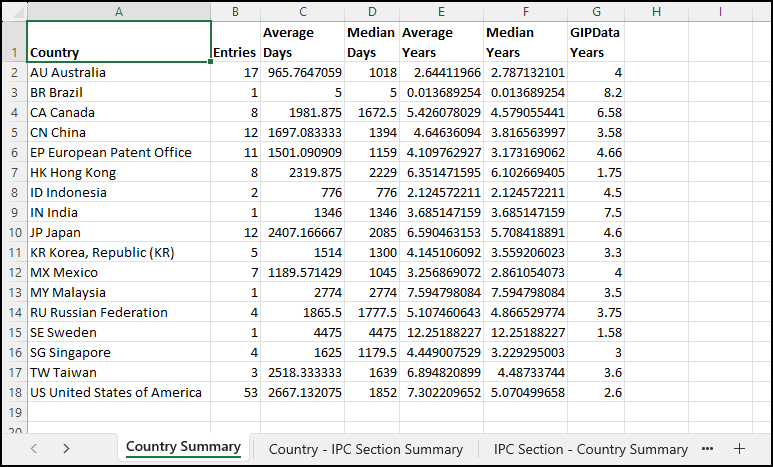
Each of these worksheets have the following details:
· Number of Entries
· Average Days
· Median Days
· Average Years
· Median Years
· GIPData Years
The ‘GIPData Years’ column gives you the User-Defined values which have been created in the Timeline Settings or the system default values if no User-Defined values have been defined.
Apart from the summary worksheets, the report has a separate spreadsheet for each country selected, with information by Group that details each patent family - Family ID, Title, File Date, Grant Date, Days to Grant and Years to Grant. Overall average and median Days to Grant and Years to Grant for the country are given. The individual country tabs will be listed in Country Code order.
The ‘Report Settings’ tab lists the report specifications chosen on the Time to Grant Analysis screen.